- On 14 April 2026 one large USDC/USDT venue cut its tick from 0.0001 to 0.00001. Another did not follow until 8 September. For 147 days the same asset traded on two grids differing by a factor of ten, with zero trading fees on both — the cleanest cross-venue tick-size experiment we know of.
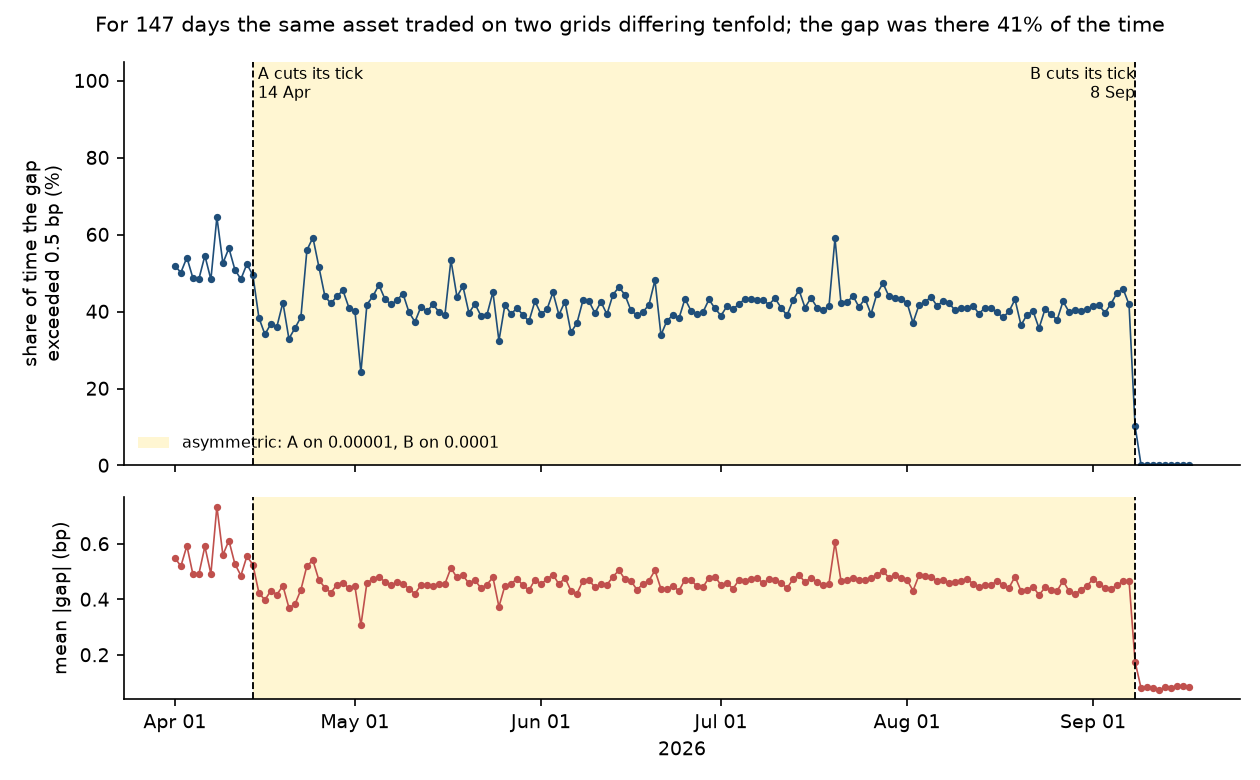
- The gap was real: the two venues' prices differed by half a basis point or more 41.5% of the time during the window and 0.10% after it closed. A four-hundredfold change, overnight, with no trend on either side.
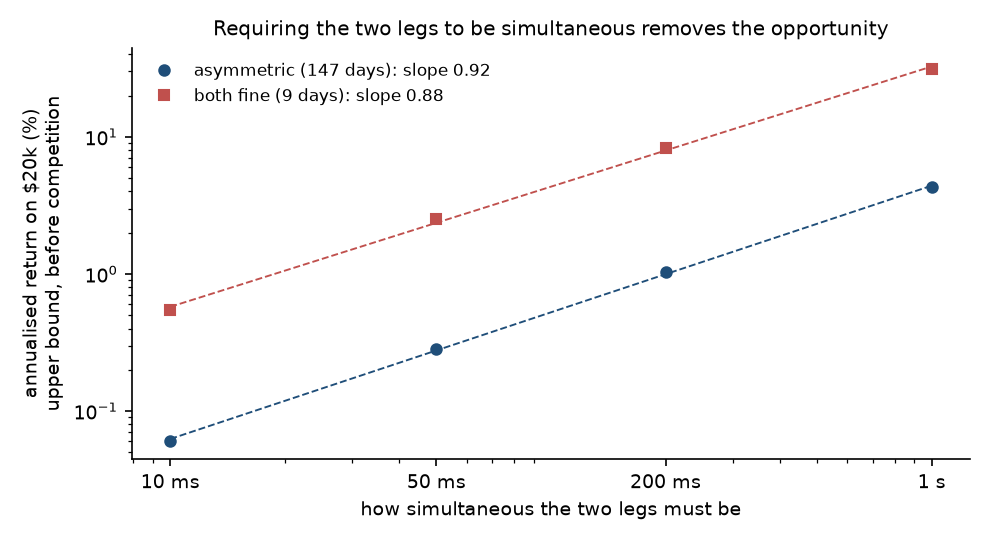
- It was worth almost nothing. Crossing it with market orders bounds at 0.1% a year once the two legs must be simultaneous. Quoting into it earns about $3 a day on a $10,000 quote from the back of the queue — and 130 times that from the front. A coarse tick does not create an arbitrage; it creates a queue rent, and the rent belongs to whoever is first in line.
A tick size is the smallest price increment a venue permits. When two venues list the same asset on different grids, the coarser venue's price is a rounding of the finer venue's price, and the rounding error looks like an arbitrage. Every screen watcher who saw the two books side by side this year saw it: one venue pinned at 1.0000 or 1.0001, the other drifting through 1.00004, 1.00007, 1.00011. This article is about what that rounding error was actually worth to a trader who tried to take it. The answer is instructive precisely because it is so small, and because the reason generalises to every market where a price grid binds.
Why this case is clean: in equities, tick-size differences between venues are rare, short and confounded by fee schedules, rebates and order-protection rules. Here there were no fees on either side, the asset's fundamental value is pinned at parity so nearly every price difference is microstructure rather than information, the two venues were recorded on one clock, and the asymmetry has a dated beginning and a dated end. Whatever a coarse grid is worth to a cross-venue trader, it should be visible.
1Date the window from the tapes, not the announcements
Neither venue published a notice we could find. Both changes are dated by counting the distinct prices at which the asset traded each day: 8 distinct prices on 13 April, 56 on 14 April.
Show the working
Both venues publish their complete trade tapes. On the coarse grid a pegged pair trades at a handful of prices a day, all multiples of 0.0001; the day the tick narrows, dozens of five-decimal prices appear. That signature dates the first venue's change to 14 April 2026 and the second's to 8 September, timed at 07:00 UTC from our order-book recording. The sample therefore has four regimes: both coarse until 13 April, asymmetric for 147 days, the change day, and both fine from 9 September. The first and last are controls for the middle.
We also ran the same count backwards over each venue's entire published history, one from December 2018 and the other from September 2021. Every one of the 143 venue-months before the changes returns 100.0% of trades on the 0.0001 grid. Each venue changed this tick exactly once in its published life, and the coarse setting survived every stress episode in between, including March 2023 when the asset traded down to 0.87. The rent we measure below was not a transient oversight; it was the standing configuration of this market for five to seven years.
2The gap: large, persistent, and gone overnight
Measured on one-second volume-weighted prices from both tapes, the cross-venue gap exceeded half a basis point 41.5% of the time for five months, every month, then fell to 0.10% the day the second venue narrowed its tick.
Show the working
Trade tapes give executed prices, which bounce between bid and ask, so a raw print-to-print comparison is dominated by bid-ask bounce. We compare one-second volume-weighted average prices instead: for each UTC second in which both venues traded, each venue's VWAP is computed and the gap is their difference in basis points. This keeps the measurement free of any order-book data, so it runs across the whole window.
| Regime | Days | Mean |gap| | ≥ 0.5 bp | ≥ 1 bp |
|---|---|---|---|---|
| Both coarse (to 13 Apr) | 13 | 0.554 bp | 52.4% | 14.9% |
| Asymmetric (14 Apr to 7 Sep) | 147 | 0.458 bp | 41.5% | 3.5% |
| Both fine (from 9 Sep) | 9 | 0.083 bp | 0.10% | 0.00% |
Month by month the asymmetric share sits between 40% and 47%. There is no single episode driving it. A trader watching these two venues would have seen, on four days out of ten by time, one venue's price at least half a basis point from the other's, on a pair whose fundamental value cannot move.
3Crossing it: an upper bound that collapses with simultaneity
Built only from prices that actually printed, the taker-to-taker bound is 4.3% a year if the two legs may be a second apart and 0.1% a year if they must be within ten milliseconds. It is higher after the window closed than during it.
Show the working
The direct way to take a cross-venue gap is to buy on the cheap venue and sell on the dear one, crossing the spread on both. Without book data this cannot be simulated exactly, but it can be bounded from above using only prices that traded: the evidence that an ask existed at P is an aggressor-buy print at P, and the evidence that a bid existed at Q is an aggressor-sell print at Q. For each matching interval a round trip is possible whenever one venue's bid exceeds the other's ask, sized by the printed volume on each leg and a $10,000 clip, with $20,000 of capital since inventory must sit on both venues.
Two things follow. First, the opportunity is an artefact of the matching window: inside one second the price itself moves, so a bid on one venue above an ask on the other is usually the price having drifted between the two prints rather than two prices existing at once. Second, and decisively, the bound is higher after the window closed at every tolerance — 0.5% a year against 0.1% at ten milliseconds. Whatever residue survives strict simultaneity is created by trade frequency, which the finer grid increased, not by the tick asymmetry. The coarse grid contributed nothing a market order could take.
4Quoting into it: the queue is the whole story
Replaying a passive $10,000 quote on the coarse venue, hedged on the fine one, over 91 days of published order-book data: $3.14 a day from the back of the queue, $407 a day from the front. Same strategy, same days, 130 times apart.
Show the working
The other way to take the gap is to be passive on the coarse venue: rest a quote at its touch and, when filled, hedge immediately on the fine-grid venue. This needs resting depth, which the coarse venue happens to publish as a daily 400-level order-book file retained for about three and a half months. We retrieved 91 coarse-grid days, re-priced the quote whenever the touch moved, and hedged each partial fill 30 milliseconds later. The result turns on one modelling choice: where in the queue the participant stands each time the order is re-priced.
| Queue assumption | Fills | Volume | Mean edge | Losing fills | Net, 91 days | Per day |
|---|---|---|---|---|---|---|
| Newcomer — join behind the resting depth | 25,857 | $22 M | +0.18 bp | 21% | +$286 | +$3.14 |
| Incumbent — first in line at every re-price | 4,702,276 | $1,330 M | +0.40 bp | 8% | +$37,056 | +$407 |
The two rows are different businesses, not two sizes of the same one. The newcomer's row is a strategy: about 5.7% a year on the $20,000 the two legs require, before competition and before any cost of moving coins between venues. The incumbent's row is a bound, not a strategy: filling $14.6 million a day means absorbing 22% of everything the venue traded, which requires winning the race to the front of every price level against $13 million of standing orders. What the row establishes is where the money was, not that it was available.
A practitioner will ask whether a passive fill on the coarse venue is the footprint of an informed sweep that has already hit the fine venue before the hedge arrives. We tested it three ways. Delaying the hedge from 30 ms to a full second changes the 91-day result from $285.56 to $283.70. Enforcing the fine venue's actually displayed depth, from our own quote recordings, gives 95.7% of the tape-based figure. And fills triggered by the largest aggressive orders ($100,000+) earn the highest edge, not the lowest. The sweep channel is real in principle and small in this sample.
5Why: a coarse tick is a rent, not a mispricing
Decomposing the coarse venue's one-basis-point spread over all 147 days: about two thirds was realised by the makers at the front of the queue, one third was price impact. The fine venue next door ran the same asset at 0.03 bp realised and 0.07 bp impact.
Show the working
Sections 2 to 4 leave a puzzle: the gap was there 41.5% of the time for five months and nobody could take it. The resolution is that the coarse grid's extra spread was never a cross-venue mispricing. It was a rent paid by that venue's own takers to the makers holding its queue, and it can be measured directly by splitting each trade's effective spread into the part the maker still held five seconds later (realised spread) and the part the price moved against them (price impact, the compensation for informed flow).
Because both venues quote a one-tick spread almost always, the mid can be reconstructed from the trade tape alone — an aggressor-buy print at P means the ask was P and the mid P minus half a tick — which lets the decomposition run over every trade on both venues for the whole window. We verified the identity against the coarse venue's own published order book on 86 days: the two methods differ by 0.005 bp on the realised spread.
| Venue and grid | Days | Effective spread | Realised spread | Price impact | Adverse-selection share | Rent paid by takers |
|---|---|---|---|---|---|---|
| Larger venue, coarse (1–13 Apr) | 13 | 1.000 bp | 0.689 bp | 0.311 bp | 0.31 | $1,016,875 |
| Larger venue, fine (14 Apr–7 Sep) | 147 | 0.100 bp | 0.033 bp | 0.067 bp | 0.67 | $885,483 |
| Smaller venue, coarse (14 Apr–7 Sep) | 147 | 1.000 bp | 0.656 bp | 0.344 bp | 0.34 | $636,527 |
| Smaller venue, fine (9–17 Sep) | 9 | 0.100 bp | 0.039 bp | 0.061 bp | 0.61 | $10,331 |
This table contains a replication. The two venues cut their ticks five months apart on the same asset and produce the same result: on a coarse grid the maker keeps about two thirds of a one-basis-point spread and the adverse-selection share is about a third; on a fine grid the maker keeps a few hundredths of a basis point and the adverse-selection share is about two thirds. Each venue's realised spread falls by a factor of about twenty at its own change, while price impact barely moves. The extra 0.9 basis point on the coarse venue bought its makers no extra protection against informed flow. It was a transfer from that venue's takers to the front of its queue, imposed by the grid.
That reconciles the gap with the money. To collect the rent one must hold queue priority in a $13 million line, which is a capital and latency position, not a trade. A newcomer at the back is filled disproportionately on the fills nobody wants. And a cross-venue arbitrageur who hedges every fill immediately hands most of the rent straight back to the other venue: even from the front of the queue the hedged edge was 0.40 bp against a realised spread of 0.62 to 0.66 bp. The rent was payable in full only to a single-venue market maker willing to carry inventory. There was money in the coarse grid, it was substantial, and it was not in the cross-venue gap that the coarse grid made visible.
6What the coarse grid did cost
Participation. On the fine grid the same venue trades four times the volume in trades half again as large, and its mid price, which used to move 122 times a day, now moves 12,400 times — often enough to be measured as a contributor to price discovery for the first time.
Show the working
Against a three-month baseline from the venue's own tape, the tick change took its quoted spread from 1.00 to 0.12 bp, resting depth at the touch from $13.5 million to $2.8 million, daily volume from $70 million to $300 million, and trades per day from 51,400 to 136,500. The larger venue's volume rose about a fifth over the same interval, so roughly a twentieth of the fourfold rise is market-wide.
The last number matters most for price discovery. A book whose spread is one tick and whose tick is a full basis point has a mid that cannot move by less than half a basis point, and a stablecoin's fair value almost never moves that much. On the coarse grid the venue's mid was not a price; it was a rounding of the other venue's price, which is why the cross-venue gap existed at all and why it carried no information. Only once both venues were on the fine grid does a vector error-correction model return stable information shares — the larger venue leading at every sampling interval from one second down to 100 milliseconds — and only then does the ordinary machinery of lead-lag measurement have anything to measure.
7Honest limits
One event per venue, 91 of 147 days with resting depth, and a hedge that is modelled rather than executed.
Show the working
- One event per venue. Neither venue has changed this tick at any other point in its published history, so the window cannot be replicated on another date. What generalises is the mechanism, not the magnitudes.
- Resting depth covers 91 of the 147 days. The coarse venue's published order book reaches back about three and a half months; the first eight weeks of the window have no depth data from any free source. The mechanism is measured over the full 147 days from tapes alone.
- The hedge is modelled. It is insensitive to delay up to a second and loses 4% when displayed depth is enforced, but no replay can model other participants hedging the same flow at the same instant. The $3.14 a day is an upper bound for that reason.
- Inventory, not execution, is the real constraint. Every capture figure assumes inventory already sits on both venues; rebalancing means an on-chain transfer that can be suspended in exactly the dislocations that would make a window valuable.
What this changes in practice: a visible, persistent cross-venue price gap is not evidence of an arbitrage. Before crediting one, ask three questions this study answers for one case — does the gap survive a simultaneity requirement matched to real latency; who holds the queue at the venue where the gap appears; and is the "edge" a mispricing or a rent whose owner is already known. For a due-diligence reviewer, a strategy deck built on a screen-visible gap should be able to answer all three with data.
The reusable checklist
Before accepting a cross-venue "arbitrage" claim:
- Is the gap measured on simultaneous quotes, or on prints that may be a second apart? Ask for the bound as a function of the matching tolerance — and for its slope.
- Is the residual opportunity larger or smaller after the structural cause is removed? If larger, the cause was never the source.
- Where in the queue does the fill model stand? Back-of-queue and front-of-queue results for the same strategy can differ by two orders of magnitude.
- Has the hedge leg been tested against the other venue's displayed depth and against delay, or does it assume the touch is always there?
- Decompose the spread: how much is realised by makers and how much is price impact? A high realised share with low impact is a rent, and rents have incumbents.
- Does the claim rest on one event? Then it establishes a mechanism, not a return.
Where this fits
This is the second in MOA's series of measurements in stablecoin market microstructure, after the depeg capacity census, and it applies the same discipline we bring to enterprise claims under Independent Verification & Validation: when a load-bearing number has never been measured, measure it before capital relies on it. Venues are anonymised in the paper because its argument depends on their rules, not their names. The full working paper, with all eleven tables and eight figures, is posted on SSRN (abstract 7502779) and available here as a PDF (20 pages). We review methodology and evidence; we don't sell or manage strategies, and nothing here is investment advice or a recommendation to trade any instrument.
- Yao, C. and Ye, M. (2018). Why trading speed matters: A tale of queue rationing under price controls. Review of Financial Studies, 31(6) — queue rationing when a tick binds, the mechanism this study observes from the cross-venue side.
- Glosten, L. R. and Harris, L. E. (1988). Estimating the components of the bid/ask spread. Journal of Financial Economics, 21(1) — the realised-spread / price-impact decomposition used in Section 5.
- Harris, L. (1994). Minimum price variations, discrete bid-ask spreads, and quotation sizes. Review of Financial Studies, 7(1) — why on a one-tick book the tick is the spread.
- Budish, E., Cramton, P. and Shim, J. (2015). The high-frequency trading arms race. Quarterly Journal of Economics, 130(4) — the equities latency race this market turns out to be the opposite of.
- Hasbrouck, J. (1995). One security, many markets. Journal of Finance, 50(4) — information shares, measurable here only once both venues were on the fine grid.
- Zhang, W. (2026). How Much Money Fits Inside a Depeg? A Census of 1,136 Stablecoin Dislocations. SSRN 7415499 — the first paper in this series.